


 Группа "Стол заказов MQL"
Рейтинг 2169
РЕКОМЕНДУЮ

 Лучшее от poker
Дневник неталантливого спекулянта v2.4...прошло 62 недели.
2018-07-21 19:39:31
Дневник неталантливого спекулянта...прошло 28 недель.
2017-06-10 14:49:00
Дневник неталантливого спекулянта v4.0...20.06.2020
2020-06-20 11:15:31
Дневник неталантливого спекулянта v2.0...прошло 20 недель.
2017-09-30 12:27:29
Дневник неталантливого спекулянта v4.0...18.04.2020
2020-04-18 11:37:40
| Поправить код для tradingview |
Ребята, кто может поправить код для tradingview?
Сам код прилагаю (во вложении). Должно быть вот так:

А получается вот так:
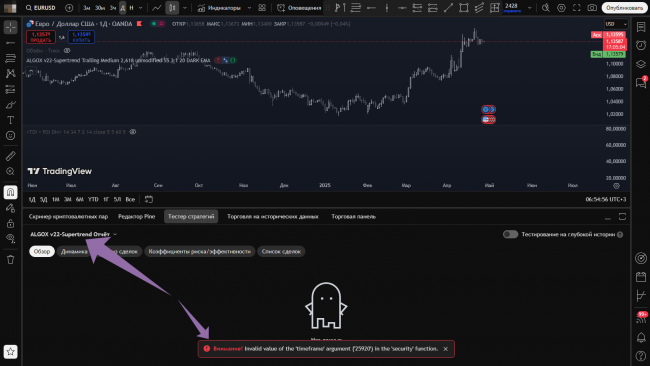
Выдаёт ошибку.
 AlgoX-V22-SuperTrend.txt (96 Kb)
Сам код прилагаю (во вложении). Должно быть вот так:

А получается вот так:

Выдаёт ошибку.
AlgoX-V22-SuperTrend.txt (96 Kb)
Понравилcя материал? Не забудьте поставить плюс и поделиться в социальной сети!
24 апреля 2025
|
03 мая 2025
|

Из недавнего:
Нажмите, чтобы обновить-

zaharik100
2 июня 2026, 14:47→ Советник OSA_Scalper_NTL2 МТ4 М5 XAUUSD (3) в Блог им. zaharik100
Кстати, он ищет индикаторы мт4 для своих систем.Мультисоветник... <>[Читать..] -

igrun
30 мая 2026, 00:54→ (болванку) операционной системы для процессора Baikal-M (BE-M1000, ARMv8-A) (2) в Стол заказов MQL
Андрей пишешь оси под заказ — ну плииз <>[Читать..] -

Kadosh123456789
7 мая 2026, 20:59→ Евро советник (4) в Стол заказов MQL
Ааааа))) Я думал код подправить))) <>[Читать..] -

drona007
7 мая 2026, 20:31→ Прикрутить стрелки на график (4) в Стол заказов MQL
Ромка, в личку загляни. <>[Читать..] -

MihaMM
7 мая 2026, 19:16→ Наконец то я его сделал!!! Индикатор IDay и советник к нему (18) в Блог им. MihaMM
уже готов робот, оказалось все гораздо проще небольшие... <>[Читать..] -
igrun
5 мая 2026, 17:58→ alert (13) в Стол заказов MQL
Андрей что скажешь о моем коде <>[Читать..] -
MihaMM
1 мая 2026, 20:59→ Тестовый счет для советников (7) в Блог им. MihaMM
:: вчера были и сильные движения хорошо отработал робот... <>[Читать..] -
igrun
28 апреля 2026, 01:48→ Правка советника (18) в Стол заказов MQL
::Multik.mq5 (13 Kb)
::Multik.ex5 (29 Kb) <>[Читать..] -
igrun
14 апреля 2026, 09:18→ Недельный обзор: XAUUSD, #SP500, #BRENT | 17 апреля 2026 (1) в Аналитика и прогнозы от компании FreshForex
что за индюки <>[Читать..] -
igrun
10 апреля 2026, 00:47→ Советник по HMA (22) в Стол заказов MQL
а там он со встроенной функцией индикатора или нет — понимаешь... <>[Читать..]
- Общая информация
- О проекте
- Наша команда
- Предупреждение о рисках
- Условия использования
- Рекламодателям
- Контакты
- Торговля
- Инструкция по FOREX для начинающих
- Сравнение FOREX и биржевого рынка
- Рейтинг брокеров Forex
- Расписание торговых сессий
- Монитор Forex (графики, календарь)
- Наши сервисы и услуги
- Forex VPS
- Тестовая лаборатория
- Рейтинг советников Форекс
- Файловое хранилище
- Конкурсы от брокеров Форекс
- Инвесторам
- Новости: финансы, бизнес, экономика
- MetaTrader
- Скачать MetaTrader 5
- Начало работы с терминалом
- Мобильная версия терминала
- Язык MQL5 для создания советников
- Структура сообщества
- Главная
- Пользователи
- Группы
- Стены
- Лента комментариев
- Избранное
Внимание! Торговля и инвестирование на финансовых рынках сопряжены с повышенным риском потери капитала!
OpenTraders - информационный ресурс, не ведет брокерскую или дилерскую деятельность, не открывает счета. Все материалы на ресурсе носят информационный характер и не являются побуждением к действию. Администрация сайта может не соглашаться с мнением авторов. См. Предупреждение о рисках
Сайт работает на территории СНГ. Любая вероятная реклама направлена исключительно на жителей за пределами Российской Федерации, если явно не оговорено обратное. Пользователи самостоятельно несут ответственность за любую рекламу в своих материалах. См. Пользовательское cоглашение
Комментарии (2)
23 poker Автор Сообщений: 876
strategy('ALGOX v22-Supertrend OPT', overlay=true, pyramiding=0, default_qty_type=strategy.percent_of_equity, default_qty_value=50, initial_capital=5000, commission_type=strategy.commission.percent, commission_value=0.02, max_bars_back=500)
// === INPUTS ===
group_general = «General Settings»
allow_longs = input.bool(true, 'Allow Longs', group=group_general)
allow_shorts = input.bool(true, 'Allow Shorts', group=group_general)
series_count = input.int(20, «Series Count», group=group_general)
lot_step = input.float(0.01, «Lot Step», group=group_general)
show_stats = input.bool(true, «Show Statistics», group=group_general)
group_atr = «ATR/Trend Settings»
atr_period = input.int(55, 'ATR Period', group=group_atr)
atr_factor = input.float(3, 'ATR Factor', group=group_atr)
atr_grid_mult = input.float(1.0, «ATR Grid Multiplier», group=group_atr)
atr_tp_mult = input.float(5.0, «ATR TP Multiplier», group=group_atr)
// === HEIKIN-ASHI PRICES (single security call for all OHLC) ===
ha = request.security(ticker.heikinashi(syminfo.tickerid), timeframe.period, [open, high, low, close])
// === ATR Calculation ===
atr = ta.atr(atr_period)
// === SuperTrend Calculation (simplified, non-repainting) ===
upper_band = ha[3] — atr_factor * atr
lower_band = ha[3] + atr_factor * atr
trend_up = na(trend_up[1])? upper_band: math.max(upper_band, trend_up[1])
trend_down = na(trend_down[1])? lower_band: math.min(lower_band, trend_down[1])
trend = ha[3] > trend_down[1]? 1: ha[3] < trend_up[1]? -1: nz(trend[1], 1)
trail = trend == 1? trend_up: trend_down
plot(trail, color=trend == 1? color.green: color.red, title=«SuperTrend Trail»)
// === Entry/Exit Signals ===
long_signal = trend == 1 and trend[1] == -1
short_signal = trend == -1 and trend[1] == 1
plotshape(long_signal, style=shape.triangleup, location=location.belowbar, color=color.lime, size=size.tiny, title=«Long Entry»)
plotshape(short_signal, style=shape.triangledown, location=location.abovebar, color=color.red, size=size.tiny, title=«Short Entry»)
// === ATR Grid and TP Levels ===
grid_step = atr * atr_grid_mult
tp_step = atr * atr_tp_mult
plot(ha[3] + grid_step, color=color.blue, title=«ATR Grid Up»)
plot(ha[3] — grid_step, color=color.orange, title=«ATR Grid Down»)
plot(ha[3] + tp_step, color=color.purple, title=«ATR TP Up»)
plot(ha[3] — tp_step, color=color.yellow, title=«ATR TP Down»)
// === Statistics (optional) ===
if show_stats
var table stats = table.new(position.bottom_right, 1, 1)
table.cell(stats, 0, 0, «Trend: » + str.tostring(trend) + "\nATR: " + str.tostring(atr, "#.##"), text_color=color.white, bgcolor=color.new(color.black, 80))
6 dok-45 Сообщений: 73
Зарегистрируйтесь или авторизуйтесь, чтобы оставить комментарий